
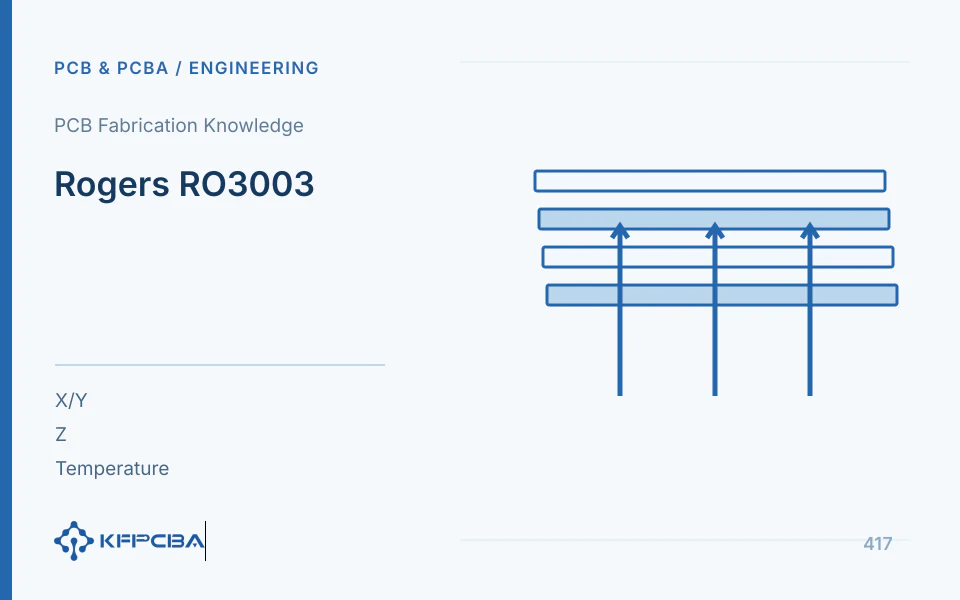
RO3003 is a ceramic-filled PTFE composite selected for low dielectric loss and relatively stable dielectric response. RF boards may still experience dimensional, stress, and interconnection changes after lamination, soldering, and temperature cycling. Analyze temperature-induced performance drift through material parameters, actual geometry, and electrical measurements together.
Retain direction and temperature zones for material parameters first
The current manufacturer RO3003 table lists process Dk of 3.00±0.04, design Dk of 3.16, and typical Df at 10 GHz of 0.0010. Typical X/Y/Z CTE values are 17, 16, and 25 ppm/°C respectively, under the table's -55 to 288 °C range. Dielectric temperature coefficient has separate conditions of -50 to 150 °C. These describe different changes; CTE cannot explain all frequency shifts.
| Focus Items | Physical Meaning | Conditions to supplement in the project |
|---|---|---|
| Dielectric temperature response | Dielectric Parameters Vary with Temperature | Frequency bands, material models, and temperature ranges |
| X/Y expansion | Planar dimensions vary with temperature | Material directions, critical trace lengths, and assembly constraints |
| Z-Axis Expansion | Dimensional changes in thickness direction | Board thickness, via group, adjacent layers, and thermal history |
| Board-level permanent change | When structural or interconnect changes become irreversible | Re-measurement after re-warming, cross-section, and electrical test |
These are typical material values, not expansion guarantees for every structure. Do not automatically equate RO3003 with similarly named variants. Purchasing part numbers and simulation material cards must match exactly.
Example magnitude of planar dimension change
Assume a 50 mm structure along X heats by 80 °C under applicable linear-approximation conditions. Using 17 ppm/°C gives ΔL=50×17×10⁻⁶×80=0.068 mm, or 68 µm. This indicates free-material dimensional-change magnitude, not actual displacement inside a housing, and cannot independently predict center-frequency changes.
RF electrical length depends on geometric length and effective permittivity together. Even with a small dielectric temperature coefficient, housing constraints, copper/dielectric differences, and connector contacts may alter response. Use applicable material-data ranges across the full temperature requirement and measure actual structures rather than extrapolating one average CTE indefinitely.
How mixed lamination and hole interconnects form stress
In multilayers, adjacent materials expand differently while copper, resin, hole-wall copper, and fasteners constrain one another. Overall thickness, symmetry, via depth, and local copper density affect stress. For RO3003 hybrid stackups, record cores, bonding layers, directions, and lamination sequences by layer, reviewing interlayer bonding and via-treatment routes.
Hole-wall or interlayer-interface failures cannot be diagnosed from two CTE tables alone. Obtain failure locations, thermal histories, and representative cross-sections; local solder rework also requires consideration of temperature gradients. Low-loss descriptions support electrical selection, not passage of product-required thermal exposure by via interconnections.
- Identify start/stop layers and adjacent materials for through holes, buried vias, and microvias.
- Record thermal exposure and profiling locations for each lamination, assembly, and rework cycle.
- Select samples containing critical hole groups and copper distributions; check connections and interfaces.
- Bind results to actual stackups and material lots before approving substitutions or structural changes.
Create linked temperature, dimensional, and RF records
| Test Phase | Simultaneous Recording | Used for Differentiation |
|---|---|---|
| Room Temperature Baseline | Board IDs, trace lengths, flatness, S-parameters, and continuity | Original panel variation |
| After Target Temperature Stabilizes | Measured-point temperatures, times, fixture conditions, and RF results | Repeatable Temperature Response |
| Return to baseline temperature | Re-measurement at same port, dimensions, and appearance | recoverable drift and residual offset |
| Post-Incident Analysis | Open location, cross-section, and material records | Interconnect or Interface Damage |
Chamber setpoints do not equal actual temperatures everywhere on a board. Cables, connectors, and calibration standards also respond to temperature; establish method repeatability first. Retain port definitions and raw data for every measurement instead of comparing screenshots from different calibration conditions.
Investigate reversible and irreversible drift differently
For shifts during heating that recover after cooling, first analyze temperature-dependent dielectric/dimensional responses and whether the system needs calibration or compensation. Persistent shifts after cooling call for fixture-movement, surface-change, and warpage checks before interface/via damage investigations. If only one port is abnormal, check connectors and soldering first rather than assigning local problems to whole-board material aging.
For inconsistent drift during repeated tests on one board, first check temperature stabilization, contact pressure, and cable condition. If boards behave consistently, compare actual stackups with design models. Link environmental, geometric, electrical, and interconnection evidence to the same board ID so records support corrective decisions.
What conclusions are required for material change versus structural change
Design outputs should explain selected Dk, foil/dielectric thickness, critical nets, and temperature requirements. Manufacturing outputs should define dimensional control, PTFE hole treatment, and hybrid combinations. Verification outputs should identify objects/environments, before/after changes, and uncovered items. Consistency among all three enables controlled material approval.
If connectors and housing constraints cause problems, another material with identical Dk may not help. If hole-group stress is responsible, via/stackup changes may matter more than loss specifications. Base actions on failure evidence, not material-number rankings. Successful existing samples cover only their structures and thermal histories.
For strongly constrained products, compare freely supported and actually mounted configurations at identical temperatures. Differences help identify fastener/housing effects, but test clamping must not change electrical references or port definitions. If assembly/disassembly itself creates major differences, improve assembly repeatability first.
Do not change foil, material, and mounting simultaneously in initial trials. Establish a credible baseline, select variables from evidence, and document expected effects in revision records. Retain intact permanently shifted samples and raw data. Cross-section analysis can then link conclusions to electrical symptoms without prematurely destroying the only evidence.
How repeated trials distinguish structural drift from measurement drift
Repeated assembly/disassembly and reconnection of one sample at identical temperature establishes measurement/assembly baselines. If before/after thermal-test changes are similar to that variation, check fixtures, cables, and fastening before concluding permanent dielectric change. Retain individual trial results, not only average curves.
At each temperature, confirm actual stabilization of board measurement points, particularly for thick structures or enclosed samples. Chamber air reaching setpoint does not mean copper and dielectric share the same state. Record waiting and measurement times to explain continuing time-dependent changes.
After comparing free and mounted conditions, strong mounting correlation calls for force-location and assembly-tolerance checks. If both states drift consistently, return to electrical models and material parameters. This focuses subsequent analysis on better-supported directions.
Frequently Asked Questions
Does lower CTE always mean more reliable?
Also assess compatibility of neighboring materials and constraints, plus vias, solder joints, and fastening structures. A lower value for one material is insufficient to establish overall reliability.
Does low Df prove thermal stability?
No. Evaluate loss and temperature response separately. Continue with Material Comparison, Manufacturing Combination and Delivery List.
Source material and applicable scope
- Rogers Corporation, “RO3003 Laminates”; version: current official product page, no fixed revision identified; checked 2026-10-17; relevant sections: Properties: Dk, Df, Thermal Coefficient, X/Y/Z CTE. Supports RO3003 identity and listed typical parameters/temperature ranges. Dimensional examples and combined test plans are engineering compilations.