
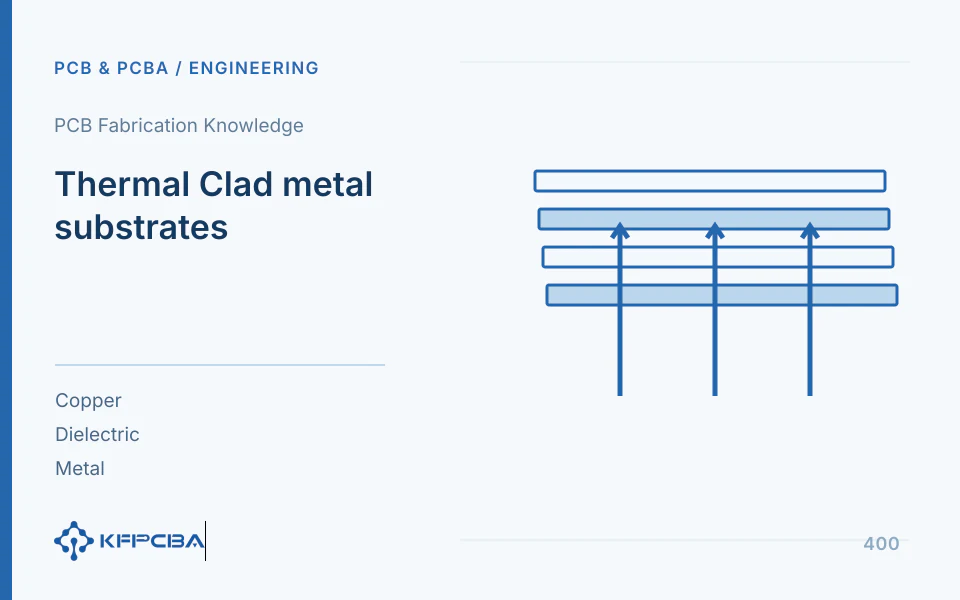
Thermal Clad forms a heat-transfer structure of copper circuitry, a thermally conductive insulating dielectric, and a metal base. Selection should consider dielectric thickness, area-normalized thermal resistance, insulation requirements, and mounting. Higher dielectric conductivity improves only one segment of the thermal path. If heat cannot move from the base to the heatsink or environment, component temperature rise may remain similar.
Draw the complete thermal path from the heat-generating component to ambient
Component internals, solder interfaces, copper spreading regions, dielectric, metal base, interface materials, and heatsink can all create temperature differences. First distinguish whether the controlled temperature is junction, case, pad, or substrate backside temperature; the hottest infrared-image point is not necessarily junction temperature. Then determine whether heat flows mainly through the board backside or also through copper traces, air, and fasteners.
When comparing two substrates, hold the heat source, copper pattern, dissipation, environment, heatsink, and fastening method constant. Changing copper area or airflow with the material prevents attributing temperature differences to the dielectric. Use actual heat dissipation, such as driver losses, rather than treating all supply input power as heat.
Four material parameters cannot be substituted for one another
| Parameter | Reading Condition | Used for Judgment |
|---|---|---|
| Dielectric Thickness | Specify µm or mil and thickness tolerance | Define heat-transfer distance, structure, and insulation design inputs |
| Thermal Conductivity k | Units: W/(m·K); retain the test method | Describes material heat-transfer properties, not independently the complete board's thermal resistance |
| Area Thermal Resistance R'' | Commonly °C·in²/W; correlate with thickness | Estimate the dielectric's temperature difference under an appropriate area assumption |
| Breakdown Test Value | Check AC/DC, specimens, and test conditions | Interpret material tests; do not directly specify continuous operating voltage |
In the manufacturer's current dielectric table, the 75 µm HT configuration lists conductivity of 2.2 W/(m·K) and area-normalized thermal resistance of 0.05 °C·in²/W. The 100 µm configuration in the same table also lists 2.2 W/(m·K), but thermal resistance is 0.077 °C·in²/W. This shows that thickness changes thermal resistance even at the same conductivity. These figures reference the current webpage, not the complete contents of an older selection guide.
Estimating a 10 W heat source and defining model boundaries
If heat passes uniformly through an effective area of 1 in² in this engineering example, R″=0.05 °C·in²/W gives dielectric resistance R=R″/A=0.05 °C/W, or approximately 0.5 °C difference at 10 W. Reducing effective area to 0.1 in² under the same one-dimensional assumption gives R=0.5 °C/W and approximately 5 °C difference. Reducing area to one tenth increases this temperature difference tenfold.
This is not an exact hot-spot prediction. Heat spreads through copper and metal layers, with three-dimensional gradients near the source; interface contact and measurement location also affect results. Use the calculation to screen sensitive variables, then model or compare prototypes using actual copper weight, source dimensions, and boundary conditions. Keep area units consistent; do not insert mm² directly into a parameter given in in².
Combine thermal, insulation, and assembly requirements in one selection table
- List heat-generating components, worst-case continuous dissipation, duty cycle, and ambient temperature, identifying measurement or estimation bases.
- Define potential relationships between copper and the metal base; derive insulation and verification requirements from the product. Do not infer usable voltage from material breakdown values.
- List each candidate dielectric's full model, thickness, tolerance, copper foil, and metal base; distinguish stocked structures from new combinations requiring verification.
- Define heatsink contact area, interface material, flatness, and fastening, identifying effects from enclosure assembly tolerances.
- Test candidate boards with the same mounting structure, then approve combinations using temperature-rise, insulation, and assembly results together.
If the insulating dielectric is the main bottleneck, evaluate other thicknesses or formulations. If the base-to-heatsink temperature difference dominates, inspect contact first. For a hot spot confined to a small component pad, inspect copper heat spreading. Thinner dielectric, higher conductivity, and greater copper area change different variables; evaluate tradeoffs with the product structure.
How to troubleshoot overheating after changing the substrate
| Observed Result | Priority Verification | Evidence Requiring Supplementation |
|---|---|---|
| Large component-to-substrate temperature difference | Solder contact, thermal pads, local copper, and dielectric paths | Solder-joint images, cross sections, and temperatures near components and on the backside |
| Large substrate-to-heatsink temperature difference | Interface material, air gap, warpage, and fastening | Contact patterns, mounting force, and temperature difference across the interface |
| Entire Structure High-Temperature | Total power dissipation, heat sink, and air flow | Stabilized power, inlet-air temperature, and mounting orientation |
| Large temperature rise variation within same batch | Dielectric thickness, soldering, and installation consistency | Prototype identification, material lots, and repeated assembly tests |
Infrared measurements must account for emissivity and metal reflections; directly comparing bare aluminum with black component surfaces is inappropriate. Record thermocouple attachment and its effect on heat flow. Outputs should include at least structural cross sections, measurement-location drawings, power, environment, stabilization criteria, and uncertainty factors to determine whether material-related changes exceed test variation.
How to organize a reproducible prototype comparison
Identify each candidate structure, record bare-board conditions, then assemble both with the same soldering program and components. If a heating resistor simulates the source, document its package, pads, and mounting area, explaining differences from the actual component's heat outlet. Measure interface flatness and fastening before power-on; then record voltage, current, and ambient temperature together. If dissipation changes, do not compare absolute temperatures alone.
Take readings after initial assembly, reassembly, and stabilized continuous operation to assess contact repeatability. If replacing an interface sheet causes large variation, improve test assembly first. Separate component-to-base, base-to-heatsink, and heatsink-to-ambient temperature differences in the report, dividing by dissipation for each segment's apparent thermal resistance. Where heat paths run in parallel, identify this as a comparison metric for the same structure. This reveals which interface offsets dielectric improvements.
Archive thermal results together with insulation, appearance, and solder-joint records when approving prototypes. A cooler prototype with dielectric damage from machining cannot be released solely for low temperature rise. Conversely, passing the agreed insulation test does not establish a good thermal path. Judge both result types separately and link them to the final manufacturing structure.
Record steady-state and transient temperature rise separately
For continuous heating, assess whether temperature ultimately stabilizes; pulse tasks also require short-term peaks and repeated heat accumulation. A thicker metal base may increase thermal capacity and slow initial heating without improving steady-state cooling. Record power-on time and load waveforms; do not compare a newly started board's low temperature with another board already at steady state.
If dissipation cycles, retain voltage, current, and temperature curves for each stage, identifying how peaks are sampled. Thermal lag exists between source and sensor; a slow backside temperature response does not establish a low component peak. For junction-temperature conclusions, use a method appropriate to the component and measurement purpose.
Post-test cooling curves can reveal interface assembly or airflow differences. Candidates with similar startup/cooling but different steady-state temperatures require a different analysis from those diverging during transients. Retain the time axis instead of treating one temperature screenshot as complete thermal performance.
Frequently Asked Questions
Is the highest thermal conductivity always the best fit?
Also consider available dielectric thicknesses, insulation, processing, and interfaces. Where the heatsink already limits temperature rise, further dielectric resistance reduction may offer little benefit; locate the actual bottleneck before selecting material.
Does increasing metal-base thickness necessarily lower temperature?
It may change lateral spreading, stiffness and mass without automatically improving the dielectric or external contact. Compare under the same dissipation and mounting conditions. Review thermal-management structures, confirm the fabrication combination and include the manufacturing data checklist in the project definition.
Source material and applicable scope
- TCLAD, “Thermal Clad Dielectrics”; version: current official webpage with no document revision stated; checked on 2026-10-17; relevant sections: Flagship Thermal Clad Dielectric Solutions and Selecting Dielectric Materials. Supports HT dielectric thickness, conductivity, area-normalized thermal resistance, and application-dependent boundaries. Calculations are this site's one-dimensional thermal-path examples, not guaranteed finished-board values.