
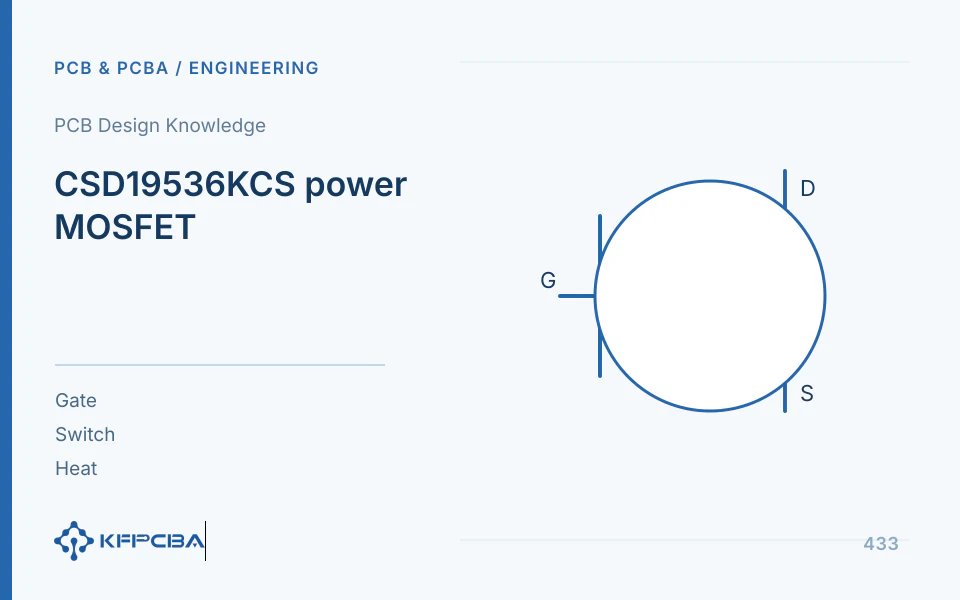
CSD19536KCS is a 100 V N-channel TO-220 MOSFET with typical 2.3 mΩ on-resistance specified in the product summary at 25 °C and VGS=10 V. This is not constant across temperatures and gate voltages. Board design must assess conduction, switching, gate drive, transients, and thermal paths together, beyond selecting low resistance.
Threshold voltage is not equal to full conduction voltage
VGS(th) describes conduction onset at a specified small current; it does not establish that a 3.3 V MCU output can directly drive large current. Check guaranteed RDS(on) at the target gate voltage and driver capability for gate charge, frequency, and high/low levels. Measure VGS relative to the actual source, not only driver output relative to system ground.
Parasitic inductance in shared high-current source paths creates voltage drops, making actual chip VGS differ from the driver. Keep gate loops compact and driver returns near the source, avoiding long shared load-current paths. Select gate resistance by comparing overshoot, ringing, switching loss, and interference; slower waveforms alone do not establish acceptance.
Estimate three types of losses separately
Approximate conduction loss is Pcond=IRMS²×RDS(on), using RMS current of the actual conducting waveform. At assumed continuous 20 A and typical 25 °C resistance of 2.3 mΩ, loss is 0.92 W. If assumed hot resistance rises to 3.45 mΩ, loss is 1.38 W. This is not a guaranteed hot value, only budget sensitivity; select values from corresponding curves and maximum conditions.
Initial hard-switching overlap loss is Psw≈0.5×VDS×I×(tr+tf)×f. Assumed 48 V, 10 A, 100 ns total overlap, and 20 kHz gives approximately 0.48 W. Actual loss may include output capacitance, body-diode reverse recovery, and parasitic ringing. Uncorrected voltage/current measurement phase error also distorts integrated loss.
| Loss item | Mandatory Input | Output Usage |
|---|---|---|
| Conduction | RMS current, junction temperature, gate voltage, and resistance | Steady-State Thermal Budget |
| Switch | Bus, current, frequency, and overlapping waveforms | Driver and gate resistance comparison |
| Gate Driver | Actual gate charge, swing, and frequency | Driver power and driver heat generation |
| Diodes and others | Free-wheeling direction, dead time, recovery, and capacitance | Complete topology loss supplement items |
Evaluate voltage/current ratings against actual stress
A 100 V drain-source rating does not recommend a 100 V bus. Turn-off spikes, regeneration, harness inductance, and abnormal loads can raise VDS. Measure worst-case conditions and allocate margins under project rules. A specified avalanche test does not authorize absorbing unknown energy every cycle; repeated stress needs separate justification.
Datasheet current ratings can likewise depend on case temperature, die, and package conditions. Check hot continuous current, short pulses, and board connector capacity separately. During linear limiting, startup charging, or slow turn-off, high VDS and current may coexist; check safe operating area instead of calculating I²R alone.
Include mounting interfaces in the TO-220 thermal path
Junction-to-case, insulating-pad-to-heatsink, and heatsink-to-ambient are different resistances. Confirm the metal tab's electrical node, select insulation/mounting, then calculate the path. “Add a heatsink” without contact area, interface thickness, clamping, and environment cannot support junction-temperature review.
The PCB carries source/drain connections and some heat. Pad, copper, screw-connection, and harness voltage drops can create additional high-current hot spots; distinguish them from chip temperature. Use thermal images to locate heat, then calibrate with suitable measurement methods. Infrared readings from shiny metal are not directly comparable to plastic cases.
Record gate-source voltage, drain-source voltage, current, and temperature together
| Operating Condition | Observation | decision |
|---|---|---|
| Power-On and Startup | VGS, VDS, current overlap, and duration | Whether linear stress occurs and startup needs adjustment |
| Steady-State Load | Voltage drop, frequency, temperature, and drive level | Does loss budget match |
| Shutdown and Reverse | Spikes, ringing, freewheeling, and regeneration | Protection and parasitic loop rectification |
| Component Substitution | Dynamic and thermal comparison on the same board under same conditions | Whether pins, gate charge, and SOA are acceptable |
Use appropriate differential/isolated probes and controlled loops so probing does not change results. Fix load and temperature before varying gate resistance or drive conditions individually. Heat increasing mainly with frequency suggests dynamic loss; scaling with current squared suggests conduction/connection drops. Both are clues requiring waveform and power verification.
Compare gate charge with actual switching speed
Average gate-drive power can be estimated as Qg×Vdrive×f, but Qg depends on drain-source voltage, gate voltage, and current. Peak drive current affects the Miller plateau and transition times; average current alone is insufficient. After calculating with datasheet-specific gate charge, measure actual waveforms and confirm driver performance across temperature and supply changes.
For assumed total gate charge of 120 nC, 10 V swing, and 20 kHz, average gate charging/discharging power is approximately 24 mW. This does not mean total MOSFET loss is only 24 mW or that the driver needs little peak current. Turn-on/off speed and parasitics can produce much larger dynamic losses; keep this separate from overlap estimates above.
In half/full bridges, check whether opposite-switch transitions raise the off-device gate through Miller capacitance and whether source inductance promotes false turn-on. Observe both VGS waveforms and current together to confirm dead time and drive loops. Let waveforms guide gate-source protection, pull-down, and layout corrections; ringing frequency alone does not justify a large suppressing capacitor.
Startup charging and electronic current limiting may operate the MOSFET linearly. The I²R model then does not apply; check SOA against actual VDS, current, pulse duration, repetition rate, and temperature. A cool-looking package does not establish acceptable short-term local die hot spots.
Substitution records should compare maximum VDS, VGS, current overlap, temperature rise, and protection under matching conditions, retaining gate resistance and drive voltage. Lower resistance or higher rated current alone does not establish better suitability for the topology.
Will lower RDS(on) always reduce temperature?
Not necessarily. A replacement may have greater gate charge, output capacitance, or different reverse recovery, increasing switching loss. Compare at the same gate voltage, temperature, topology, and frequency, confirming package and SOA. For further junction-temperature budgeting, compare Thermal parameters and probe pairing methods; do not turn typical 25 °C values directly into board acceptance criteria.
Locate heat sources before replacing power components
Record MOSFET case, lead solder-joint, copper-path, and connector temperatures together. If joints/connectors dominate, lower on-resistance may not help. If the driver heats first, inspect gate charging/discharging and frequency. Identifying heat sources reduces untargeted substitutions.
For heatsink versions, retain interface materials, insulators, mounting, and electrical nodes; test with matching assembly conditions. For repeated pulses, archive width, interval, initial temperature, and waveforms. Equal average current does not establish equal peak thermal stress; retain these inputs with verification conclusions.
Source material and applicable scope
- Texas Instruments, “CSD19536KCS 100V N-Channel NexFET Power MOSFET”; Rev. C; checked on 2026-10-17; relevant sections: Product Summary, Electrical Characteristics, Typical Characteristics, Safe Operating Area, Thermal Information. Supports static/dynamic parameters and thermal boundaries for the 100 V TO-220 component under specified conditions.